Drawing board

Lemon city
Lemon city

When I was on university we had a PC application for creating geometrical drawings. As I already knew about software development at that time, I was very very impressed by that application.

Was 20 years ago, internet was not yet there at that time, but I did not forget about the program and you can still download it from the company which is developing and selling it.

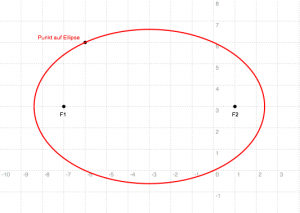
A couple of years ago, when I had to learn JavaScript, the language for the internet browser, I decided to combine learning with some fun. But it took me much longer than I would have been willing to invest. After a some months, a break of about some years and a restart, here is the result: Lemon City

The difficulty was finding out how to do the geometrical calculations! I never really had vector calculation in school. What I know about it is from some lessons on university. But I was able to find for most of the problems solutions. Some solved in this way, some solved in that way. Once I will come back and read a book about vector calculation and create a new library!

Some features are still missing from the original solution I worked with 20 year ago. But I am already very proud about what I were able to realize. When there is the next time slot where I have enough time, I will continue, for sure.

Bug catcher

BugCatcher
BugCatcher

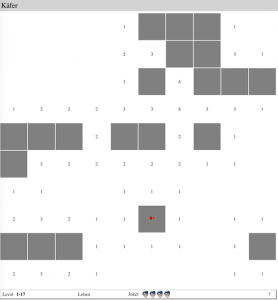
Tried to develop a small app similar to Minekeeper, a game I was playing endlessly when I was a young developer.

Here is the result: a joker can be used to get help. Clicking longer on a cell sets a flag on it.

If a cell which does not contain any surrounding mines is clicked, the cell and all surrounding cells are opened as well.

Try it here: BugCatcher …


Book about the US presidents

Barack Obama
Barack Obama

I have finished all 44 presidents (in reality only 43 because one was president twice). After finishing I thought that I could create a book by just adding a short description about every president.

I cost me a couple of hours while I was on holiday in Austria but now I have finished. I used a software you can download from the internet to create the book and now you can download or buy it from blurb.de.

Have fun to read it and investigate the paintings. Soon the book will also be available on Amazon.

Cone of uncertainty

Why is estimating the effort necessary for a software development project so much more complicated than estimating the construction of a building? Because a software development project is a new project with mostly new people and often new technology for every new project.

Once again I had to experience that the estimation for a project was too optimistic. It is easy to estimate the expectable effort if yourself will be the person who has to realise the project. I remember that all estimations I did for myself where exact.

But as soon as the project is larger and is about a new business area, you have to do more work. You will have to do different kinds of estimations, for example a SCRUM story point estimation, a comparison with a similar project, a function point analysis and so on.

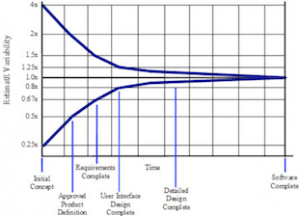
Now, there is the cone of uncertainty which tells us that an estimation done before the projects requirements were investigated properly could be far far away from the real effort you will spend. And the estimation will only come down to a more realistic value if you do another estimation after the requirements are clearer or even after you have started developing.

Patterns of Enterprise Application Architecture

Enterprise Application

This is a great book about development. One of the best books I ever read to increase my skills necessary for my job. Not only that all the different possible architecture are described in a very understandable manner.

This book also makes clear, that you do not always need the most complicated architecture. For a simple application, a simple architecture could totally fulfill your needs.

Which leads back to one of the most important principles in software development: KISS, keep it short and simple. Software gets at the end always much more complicated that planned or expected at the beginning. Lot of developers do not fear the complexity of the source code they produce and at the end you get stuck in a messy code, impossible to have the necessary overview.

Once again I saw when reading this book, that many of the architecture, similar to design patterns are used without knowing them by name. Whatever design or architecture you select for your application, important is that you and your team know it and keep coding to the selected pattern.

Fowler also describes in a very clear example the data mapper which is a pattern I created myself years ago out of long experience. Its nice to see that I was on the right way and that a guru like Fowler describes it in a very similar way as we designed it then.

Mandelbrot in Excel

Mandelbrot Excel
Mandelbrot Excel

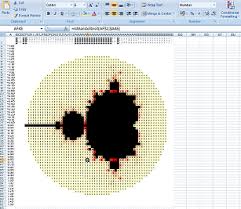
Here is the result. It took me only minutes to implement it and as you can see in the different sheets, I have also implemented the Julia set in the same workbook.

The sheets are for 3 different resolutions and you see that the range where both sets are visible is from -2.2 / -1.5 to 0.8 / 1.5 for the Mandelbrot set and from -1.8 / -1.5 to 1.8 / 1.5 for the Julia Set.

I realized the different colors with conditional formatting which is a nice feature of Microsoft Excel. Points which are part of the set are black, points which are not part of the set are colored. The color depends on the number of iterations necessary to decide that they are diverting and is going from red and yellow to white.

You can download the Excel workbook from here. You might have to allow the basic script!

Julia Set

Julier Set
Julier Set

I am a fan of the Mandelbrot set since I have seen it the first time. I developed a screen saver for windows which displays the Mandelbrot set and zooms in randomly.

I also tried to develop something similar for the iPhone but did not succeed for the time. When I was investigating possibilities to draw lines in HTML code, I saw that with HTML 5 there is a new tag <Canvas> which allows exactly what I need.

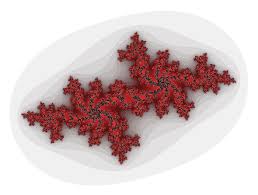
Here is the result. I have created a page which shows the Mandelbrot set and the same for the Julia set. Both are very impressive. You can zoom in by clicking somewhere in the graph and even move the graph with the mouse.

Here is the page with the Mandelbrot set and
here is the page with the Julia Set.

Steven Jobs

Steve Jobs
Steve Jobs

When I came back from my holiday in Ocotober, I saw latest times magazine with a picture of Steve Jobs on the front page and the subtitle 1955 – 2011. First I could not believe it and went to wikipedia. And there I saw that Jobs really died a week ago. I was shocked. Since I have an iPhone and now also an iPad I am a big fan of Apple.

Who in the hell should invent such nice new products now? I am sure, Apple will not be able for a long time! Immediately I ordered the new biography on Amazon which I got on 24th.

The last couple of days I read the biography and I have to say: This is one of the most interesting books I have ever read. I read in the train, in the morning, in the afternoon, at the weekend, at night, when ever I had a couple of minutes for free. Very very good book. The best book I have read in years!